What Is PQR?
PQR stands for Product, Quantity and Routing. PQR analysis is a way of answering the questions:
- What do you make?
- How many do you make?
- What processes are required to make it?
In Thinking Lean, everything is related to takt time (pace).
To calculate the takt time or rhythm of a value stream you must know two things:
1. Available time 2. Demand
For example, if you work eight hours per day and have a demand of 100 units, then you would have 480 minutes of available time divided by 100. Your resulting takt time would be 4.8 minutes per unit.
This is easy enough if you only make one kind of product. The challenge for our clients and most job shops is to determine takt time within high mix, low volume environments.
We’ve discussed the importance of finding a common denominator (unit of work rather than number of units sold) to equalize the amount of process times across a wide variety of product types. This blog will deal with identifying unique value streams.
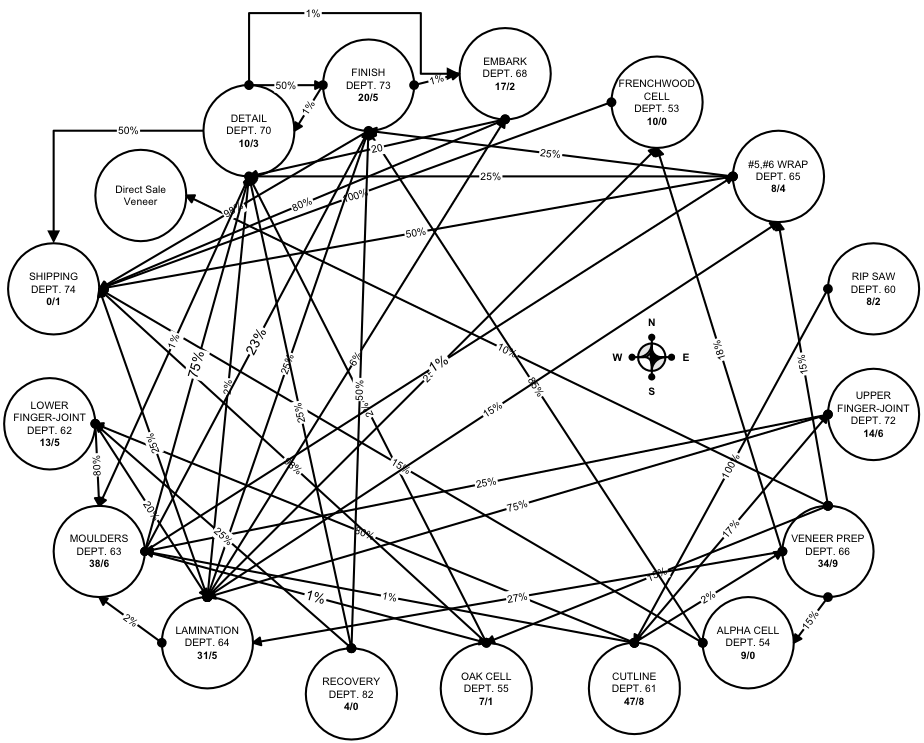
In working with a secondary wood manufacturing client, we found that they had about a dozen unique value streams. They machined window and door components for a variety of customers (Pella, Anderson and many more), they also made door frames, flat jambs, lineal mouldings and the list went on and on. This 400 person business was set up as most companies were at the time. That is, in functional departments. They wanted to cellularize, which would mean aligning each value stream to permit and foster one piece flow where possible.
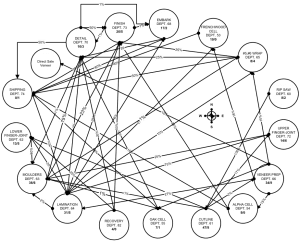 How could they untangle the web of thousands of SKU’s (part numbers) currently weaving their way through a dozen departments? PQR analysis was the answer.
Let’s use the following table to represent just a small percentage of the parts that they produced.
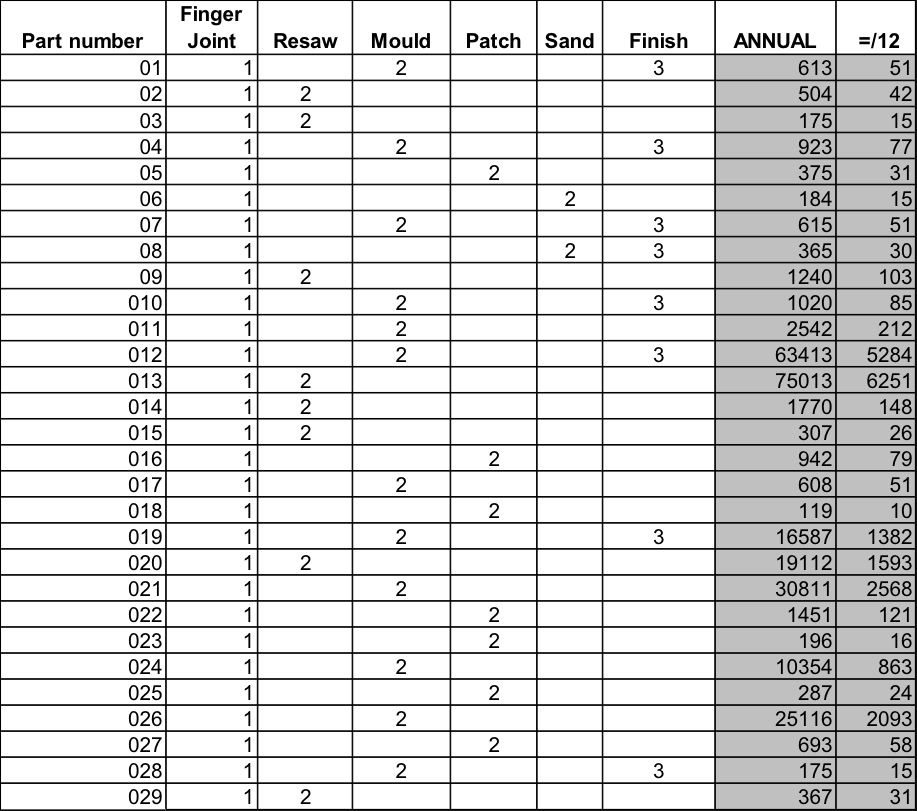 Part number is the P in PQR, the Q or annual Quantity is shown in the shaded column to the right. The R or Routing is shown in the body of the table; each part number has a sequence 1,2,3,4 etc… showing the process steps required for that unique part number. For example part number has only 3 steps: 1. Fingerjoint, 2. Mould 3. Finish. Part number 2 only has two process steps.
It is very difficult to see a pattern here, but once sorted by required process steps as shown in the next table, the value streams begin to emerge.
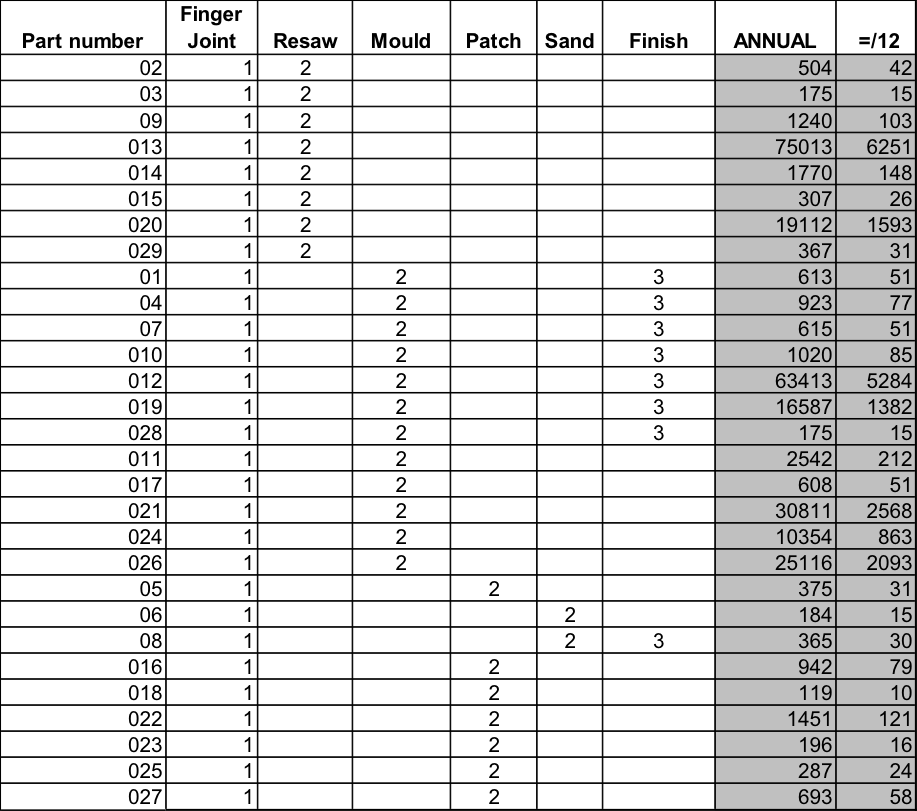 If the decision to divide the plant into three distinct value streams makes sense, we could identify the takt time for each value stream.
For example, those products within the first group that only Fingerjoint and Resaw total 98,488 units per year. If there are 120,000 minutes of available time in a year then dividing this time by 98,488 yields a takt time of 1.2 minutes per unit. If there is 8 minutes of labor required for each unit, then 8/1.2 = 6.6 (this would be a seven-person team).
It is challenging to value stream map your entire organization, but much more manageable to map each individual value stream.
As you can see from the example above, PQR analysis can help you identify your value streams and sort them out.
A note about the author: Gary Conner has been a beloved OMEP consultant for many years, but is now retired. Our team is grateful for his time with us. Thankfully Gary left his wisdom with us through his books.